Case Study - Naive Bayes
Case Study - Naive Bayes
第四章で学んだナイーブベイズに関わる以下のケーススタディをまとめてあります。
Packages and Datasets
本ページでは以下の追加パッケージを用いています。
| Package | Descriptions |
|---|---|
| class | Functions for Classification |
| e1071 | Misc Functions of the Department of Statistics, Probability Theory Group (Formerly: E1071), TU Wien |
| gmodels | Various R Programming Tools for Model Fitting |
| snowballC | Snowball Stemmers Based on the C ‘libstemmer’ UTF-8 |
| tm | Text Mining Package |
| DT | A Wrapper of the JavaScript Library ‘DataTables’ |
| klaR | Classification and Visualization |
| profvis | Interactive Visualizations for Profiling R Code |
| skimr | Compact and Flexible Summaries of Data |
| tidymodels | Easily Install and Load the ‘Tidymodels’ Packages |
| tidytext | Text Mining using ‘dplyr’, ‘ggplot2’, and Other Tidy Tools |
| tidyverse | Easily Install and Load the ‘Tidyverse’ |
利用しているデータセットは各セクションで確認してください。
重複データをクレンジングしてみる
『Rによる機械学習』の第4章で利用したデータには\(400\)超の同一メッセージが含まれていましたが、これらのメッセージを除去することなくトレーニングとテストを行いました。本Case Studyでは同一メッセージを削除すると結果がどのように変わるかを見てみました。
データのクレンジング
最初にテキストと同様のクレンジングを行い、クレンジングしたデータ中にどの程度の重複メッセージが含まれているかを確認します。
(sms_raw <- "./sample/mlwr/sms_spam.csv" %>%
  readr::read_csv() %>%
  dplyr::mutate(type = forcats::as_factor(type),
                text = tolower(text) %>%
                  stringr::str_replace_all("[[:digit:]]", " ") %>%
                  tm::removeWords(tm::stopwords()) %>%
                  gsub("[[:punct:]]+", " ", .) %>%
                  tm::stemDocument() %>%
                  stringr::str_squish())) %>%
skimr::skim_to_wide()クレンジングする前より増え重複メッセージは\(506\)あることが分かります。また、長さが\(0\)のデータがあるので、これらを除去します。
(sms_raw <- sms_raw %>%
  dplyr::filter(!(text == "")) %>%
  dplyr::distinct(type, text)) %>%
  DT::datatable()
コーパス化とデータの準備
重複データを除去しデータ数が\(5052\)となりました、このデータをテキストと同じ比率(75:25)でトレーニングデータとテストデータに分割します。
sms_dtm <- sms_raw %>%
  with(tm::VectorSource(text)) %>%
  tm::VCorpus() %>%
  tm::DocumentTermMatrix()

m <- nrow(sms_raw)
n <- as.integer(m * 0.75)

sms_dtm_train <- sms_dtm[1:n, ]
sms_dtm_test <- sms_dtm[(n + 1):m, ]

sms_train_labels <- sms_raw[1:n, ]$type
sms_test_labels <- sms_raw[(n + 1):m, ]$type

sms_freq_words <- sms_dtm_train %>%
  tm::findFreqTerms(lowfreq = 5, highfreq = Inf)

sms_dtm_freq_train <- sms_dtm_train[ , sms_freq_words]
sms_dtm_freq_test <- sms_dtm_test[ , sms_freq_words]

convert_counts <- function(x) {
  x <- ifelse(x > 0, "Yes", "No")
}

sms_train <- apply(sms_dtm_freq_train, MARGIN = 2, convert_counts)
sms_test  <- apply(sms_dtm_freq_test, MARGIN = 2, convert_counts)
念のためにトレーニングデータとテストデータにおけるスパム比率を見ておきます。
## .
##       ham      spam
## 0.8793877 0.1206123## .
## ham spam
## 0.898654 0.101346
トレーニングと予測
では、ラプラス推定量を\(0~4\)の間で変化させて交差検証で正確度を確認してみましょう。
cl <- parallel::makePSOCKcluster(4L)
doParallel::registerDoParallel(cl)

tuned <- caret::train(x = sms_train, y = sms_train_labels, method = "nb",
                      tuneGrid = expand.grid(fL = c(0:4), usekernel = FALSE,
                                             adjust = 1),
                      trControl = caret::trainControl(method = "cv"))

parallel::stopCluster(cl)

tuned
## Naive Bayes
##
## 3789 samples
## 1094 predictors
## 2 classes: 'ham', 'spam'
##
## No pre-processing
## Resampling: Cross-Validated (10 fold)
## Summary of sample sizes: 3410, 3411, 3410, 3409, 3409, 3411, ...
## Resampling results across tuning parameters:
##
## fL Accuracy Kappa
## 0 0.9844550 0.92431102
## 1 0.9659660 0.85255096
## 2 0.8497956 0.53445366
## 3 0.4913314 0.14721320
## 4 0.1390493 0.00515239
##
## Tuning parameter 'usekernel' was held constant at a value of FALSE
##
## Tuning parameter 'adjust' was held constant at a value of 1
## Accuracy was used to select the optimal model using the largest value.
## The final values used for the model were fL = 0, usekernel = FALSE
## and adjust = 1.
ラプラス推定量(\(= 0\))
交差検証の結果からラプラス推定量を\(0\)としてテスト結果を確認します。
e1071::naiveBayes(sms_train, sms_train_labels, laplace = 0) %>%
  predict(sms_test) %>%
  gmodels::CrossTable(sms_test_labels,
                      prop.chisq = FALSE, prop.t = FALSE, prop.r = FALSE,
                      dnn = c('predicted', 'actual'))
##
##
## Cell Contents
## |-------------------------|
## | N |
## | N / Col Total |
## |-------------------------|
##
##
## Total Observations in Table: 1263
##
##
## | actual
## predicted | ham | spam | Row Total |
## -------------|-----------|-----------|-----------|
## ham | 1132 | 19 | 1151 |
## | 0.997 | 0.148 | |
## -------------|-----------|-----------|-----------|
## spam | 3 | 109 | 112 |
## | 0.003 | 0.852 | |
## -------------|-----------|-----------|-----------|
## Column Total | 1135 | 128 | 1263 |
## | 0.899 | 0.101 | |
## -------------|-----------|-----------|-----------|
##
##
最近傍法との比較
最近傍のケーススタディ ではirisデータセットを用いて品種の判別を行いました。これをナイーブベイズを使うと予測精度がどのように変わるかを確認してみます。
トレーニングデータとテストデータの作成
最近傍のケーススタディ と同様にirisデータセットから各品種同数をランダムに抽出したトレーニングデータとテストデータを用います。
トレーニングデータ
trainset %>%
  ggplot2::ggplot(ggplot2::aes(x = Sepal.Width, y = Sepal.Length,
                               colour = Species, shape = Species)) +
    ggplot2::geom_point() + ggplot2::xlim(2, 4.5) + ggplot2::ylim(4, 8) +
    ggplot2::scale_color_brewer(palette = "Dark2")
テストデータ
## Joining, by = c("Sepal.Length", "Sepal.Width", "Petal.Length", "Petal.Width", "Species")testset %>%
ggplot2::ggplot(ggplot2::aes(x = Sepal.Width, y = Sepal.Length,
colour = Species, shape = Species)) +
ggplot2::geom_point() + ggplot2::xlim(2, 4.5) + ggplot2::ylim(4, 8) +
ggplot2::scale_color_brewer(palette = "Dark2")
k近傍法
k近傍法のkの値は交差検証(e1071::tune.knn関数)の結果を用います。
##
## Parameter tuning of 'knn.wrapper':
##
## - sampling method: 10-fold cross validation
##
## - best parameters:
##   k
##  11
##
## - best performance: 0.03
##
## - Detailed performance results:
##     k      error dispersion
## 1   1 0.04909091 0.05181730
## 2   2 0.03909091 0.05053433
## 3   3 0.05909091 0.06939989
## 4   4 0.05000000 0.05270463
## 5   5 0.06000000 0.06992059
## 6   6 0.05000000 0.07071068
## 7   7 0.03909091 0.06910818
## 8   8 0.04909091 0.07005180
## 9   9 0.04000000 0.06992059
## 10 10 0.04909091 0.07005180
## 11 11 0.03000000 0.06749486
## 12 12 0.03000000 0.06749486
## 13 13 0.04000000 0.06992059
## 14 14 0.05000000 0.07071068
## 15 15 0.05000000 0.07071068
## 16 16 0.05909091 0.06939989
## 17 17 0.05000000 0.07071068
## 18 18 0.05000000 0.07071068
## 19 19 0.05909091 0.06939989
## 20 20 0.05000000 0.07071068
## 21 21 0.05000000 0.07071068
## 22 22 0.05000000 0.07071068
## 23 23 0.04000000 0.06992059
## 24 24 0.04000000 0.06992059
## 25 25 0.05000000 0.07071068
## 26 26 0.05000000 0.07071068
## 27 27 0.05000000 0.07071068
## 28 28 0.04000000 0.06992059
## 29 29 0.04000000 0.06992059
## 30 30 0.05000000 0.07071068class::knn(train = trainset[, -5], test = testset[, -5],
k = tuned$best.parameters$k, cl = trainset$Species) %>%
gmodels::CrossTable(testset[, 5], dnn = c('predicted', 'actual'),
prop.chisq = FALSE, prop.t = FALSE, prop.r = FALSE)##
##
## Cell Contents
## |-------------------------|
## | N |
## | N / Col Total |
## |-------------------------|
##
##
## Total Observations in Table: 45
##
##
## | actual
## predicted | setosa | versicolor | virginica | Row Total |
## -------------|------------|------------|------------|------------|
## setosa | 15 | 0 | 0 | 15 |
## | 1.000 | 0.000 | 0.000 | |
## -------------|------------|------------|------------|------------|
## versicolor | 0 | 15 | 1 | 16 |
## | 0.000 | 1.000 | 0.067 | |
## -------------|------------|------------|------------|------------|
## virginica | 0 | 0 | 14 | 14 |
## | 0.000 | 0.000 | 0.933 | |
## -------------|------------|------------|------------|------------|
## Column Total | 15 | 15 | 15 | 45 |
## | 0.333 | 0.333 | 0.333 | |
## -------------|------------|------------|------------|------------|
##
##
ナイーブベイズ
ナイーブベイズのラプラス推定量はデフォルト値を使います。
trainset %>%
  e1071::naiveBayes(Species ~ ., data = .) %>%
  predict(testset) %>%
  gmodels::CrossTable(testset[, 5], dnn = c('predicted', 'actual'),
                      prop.chisq = FALSE, prop.t = FALSE, prop.r = FALSE)
##
##
## Cell Contents
## |-------------------------|
## | N |
## | N / Col Total |
## |-------------------------|
##
##
## Total Observations in Table: 45
##
##
## | actual
## predicted | setosa | versicolor | virginica | Row Total |
## -------------|------------|------------|------------|------------|
## setosa | 15 | 0 | 0 | 15 |
## | 1.000 | 0.000 | 0.000 | |
## -------------|------------|------------|------------|------------|
## versicolor | 0 | 15 | 2 | 17 |
## | 0.000 | 1.000 | 0.133 | |
## -------------|------------|------------|------------|------------|
## virginica | 0 | 0 | 13 | 13 |
## | 0.000 | 0.000 | 0.867 | |
## -------------|------------|------------|------------|------------|
## Column Total | 15 | 15 | 15 | 45 |
## | 0.333 | 0.333 | 0.333 | |
## -------------|------------|------------|------------|------------|
##
##
処理手順を改善する
テキストデータの分類にナイーブベイズを適用するにはクレンジング処理、コーパス処理、トークン処理などの多数の処理があり、各処理で扱うデータ形式が異なっています。ナイーブベイズ分類器(e1071::naiveBayes)自体はデータフレーム型を扱うことができますので、データフレーム型を中心とした処理にすることでtidyverseパッケージによる処理の効率化を図ってみます。
テキストデータ処理
テキストデータを処理する際にtmパッケージを使う必要があるのは以下の処理のみです。
- コーパス処理
- トークン化(DTMの作成)
- 頻出度の低いトークンの削除
つまり、それ以外の処理は扱いなれたデータフレーム型で処理することが可能と考えらえます。そこで、処理を以下のように組み立て直してみます。なお、Stepの項はテキストにおける処理順に番号をフッタものです。
| Step | Processing | Input Type | Output Type | Package |
|---|---|---|---|---|
| 1 | データの収集 | CSV | ||
| 2 | データの研究と準備 | |||
| -1 | データの読み込みと確認 | CSV | Data Frame | (Base R) |
| -2 | データ型の変換 | Data Frame | Data Frame | (Base R) |
| -4 | クレンジング(小文字化) | Data Frame | Data Frame | tidyverse |
| -5 | クレンジング(数字の削除) | Data Frame | Data Frame | tidyverse |
| -6 | クレンジング(Stopwordの削除) | Data Frame | Data Frame | tidyverse, tm |
| -7 | クレンジング(記号の削除) | Data Frame | Data Frame | tidyverse |
| -8 | クレンジング(ステミング) | Data Frame | Dara Frame | tidyverse, SnowballC |
| -9 | クレンジング(空白の削除) | Data Frame | Data Frame | tidyverse |
| -3 | コーパス化 | Data Frame | List | tm |
| -10 | 単語への分割(トークン化) | List | Matrix | tm |
| -13 | 頻出度の低いトークンの削除 | Matrix | Data Frame | tm |
| -14 | カテゴリカルデータへ変換 | Data Frame | Data Frame | tidyverse |
| -12 | ラベルデータの作成 | Data Frame | Data Frame | tidyverse |
| -11 | 訓練・テストデータへの分割 | Dara Frame | Data Frame | rsample |
| 3 | データによるモデルの訓練 | Dara Frame | List | e1071 |
| 4 | モデルの性能評価 | |||
| -1 | 分類(予測)の実行 | List, Data Frame | Vector | (Base R) |
| -2 | 分類(予測)結果の評価 | Vector | List | gmodels |
Step A - データクレンジング
データクレンジング自体は輪講でも説明したようにデータフレーム型のみで処理することが可能です。データは原書著作者のGitHubにある 最新版 を使っています。
(sms_raw <- "./sample/Machine Learning with R (2nd Ed.)/Chapter 04/sms_spam.csv" %>%
  readr::read_csv() %>%
  dplyr::mutate(type = forcats::as_factor(type),
                text = stringr::str_to_lower(text) %>%
                  stringr::str_replace_all("[[:digit:]]", " ") %>%
                  tm::removeWords(tm::stopwords()) %>%
                  gsub("[[:punct:]]+", " ", .) %>%
                  tm::stemDocument() %>%
                  stringr::str_squish()))
Step B - DTMの作成と頻出ワードの抽出
コーパス処理とトークン化はtmパッケージを用いて行い、DTMをアウトプットとします。
(sms_dtm <- sms_raw %>%
  with(tm::VectorSource(text) %>% tm::VCorpus()) %>%
  tm::DocumentTermMatrix()) %>%
  tm::inspect()
## <<DocumentTermMatrix (documents: 5559, terms: 5995)>>
## Non-/sparse entries: 42686/33283519
## Sparsity : 100%
## Maximal term length: 34
## Weighting : term frequency (tf)
## Sample :
## Terms
## Docs call can come day free get just know now will
## 1814 1 0 0 0 0 0 0 0 0 0
## 2046 0 0 0 0 0 0 0 1 0 0
## 295 0 0 0 0 1 0 0 0 0 0
## 2993 0 1 0 1 0 0 0 0 0 0
## 313 0 0 1 2 0 1 0 0 0 12
## 3201 0 0 0 0 1 0 0 0 0 0
## 3522 0 0 0 2 0 0 0 0 0 0
## 399 0 0 0 2 0 0 0 0 0 0
## 5068 0 0 0 6 0 0 0 0 0 0
## 5279 0 3 0 0 1 1 0 0 0 0作成されたDTMから頻出語リスト(ベクトル型変数)を作成しておきます。
Step C - 頻出度の低いトークンを削除
頻出後リストを用いて頻出度の低いトークンを削除したらデータフレーム型に変換し、データを文字型の“Yes/No”に変換し、ラベルリストを結合して、ナイーブベイズの処理対象となるデータフレーム型データ(sms_data)の完成です。
sms_data <- sms_dtm[, sms_freq_words] %>%
  as.matrix() %>%
  as.data.frame() %>%
  dplyr::mutate_if(is.numeric,
                   function(.){ifelse(. > 0, "Yes", "No")}) %>%
  dplyr::mutate(.label = sms_raw$type) %>%
  dplyr::select(.label, dplyr::everything())
Step D - トレーニングデータとテストデータへの分割
データフレーム型に変換できましたので、rsampleパッケージを用いてトレーニング用データとテスト用データを作成します。
set.seed(seed)
split <- sms_data %>%
  rsample::initial_split(prop = 1 - 1390/5559)

sms_train <- split %>%
  rsample::training()   # .$in_idに該当するデータを取り出す

sms_test <- split %>%
  rsample::testing()    # .$in_idに該当しないデータを取り出す
Step E - トレーニング、テスト、評価
トレーニング用データを用いて学習を行った後、テスト用データを分類(予測)し、テスト用データのラベルを用いて分類(予測)結果をクロス集計します。
e1071::naiveBayes(sms_train[, -1], sms_train[, 1]) %>%
  predict(sms_test[, -1]) %>%
  gmodels::CrossTable(sms_test$.label, dnn = c('predicted', 'actual'),
                      prop.chisq = FALSE, prop.t = FALSE, prop.r = FALSE)
##
##
## Cell Contents
## |-------------------------|
## | N |
## | N / Col Total |
## |-------------------------|
##
##
## Total Observations in Table: 1390
##
##
## | actual
## predicted | ham | spam | Row Total |
## -------------|-----------|-----------|-----------|
## ham | 1185 | 20 | 1205 |
## | 0.997 | 0.099 | |
## -------------|-----------|-----------|-----------|
## spam | 3 | 182 | 185 |
## | 0.003 | 0.901 | |
## -------------|-----------|-----------|-----------|
## Column Total | 1188 | 202 | 1390 |
## | 0.855 | 0.145 | |
## -------------|-----------|-----------|-----------|
##
## 処理時間の比較
データフレームを用いたクレンジング処理がテキストのサンプルコードにおけるクレンジング処理とどの程度の差があるかを確認します。ライブラリとデータファイルの読み込みは処理時間に含めず、読込んだデータからDTMを作成するまでの処理時間をprofvisパッケージを用いて計測します。
注)Windowws環境だとprofvisが正しく計測できない場合があるようです。
tidyverseパッケージによるクレンジング処理
library(tidyverse)

sms_raw <- "./sample/Machine Learning with R (2nd Ed.)/Chapter 04/sms_spam.csv" %>%
  readr::read_csv()

profvis::profvis({
  sms_raw <- sms_raw %>%
    dplyr::mutate(type = forcats::as_factor(type),
                  text = stringr::str_to_lower(text) %>%
                    stringr::str_replace_all("[[:digit:]]", " ") %>%
                    tm::removeWords(tm::stopwords()) %>%
                    gsub("[[:punct:]]+", " ", .) %>%
                    tm::stemDocument() %>%
                    stringr::str_squish())

  sms_dtm <- sms_raw %>%
    with(tm::VectorSource(text) %>% tm::VCorpus()) %>%
    tm::DocumentTermMatrix()
})
tmパッケージによるクレンジング処理
library(tm)
library(SnowballC)

sms_raw <- read.csv("./sample/Machine Learning with R (2nd Ed.)/Chapter 04/sms_spam.csv",
                    stringsAsFactors = FALSE)

profvis::profvis({
  sms_raw$type <- factor(sms_raw$type)

  sms_corpus <- VCorpus(VectorSource(sms_raw$text))
  sms_corpus_clean <- tm_map(sms_corpus, content_transformer(tolower))
  sms_corpus_clean <- tm_map(sms_corpus_clean, removeNumbers)
  sms_corpus_clean <- tm_map(sms_corpus_clean, removeWords, stopwords())
  sms_corpus_clean <- tm_map(sms_corpus_clean, removePunctuation)
  sms_corpus_clean <- tm_map(sms_corpus_clean, stemDocument)
  sms_corpus_clean <- tm_map(sms_corpus_clean, stripWhitespace)
  sms_dtm <- DocumentTermMatrix(sms_corpus_clean)
})
tidyなテキストマイニング
tmパッケージはテキストマイニングのデファクトスタンダード的なパッケージですが、処理対象がリスト形式であるために扱いにくい面があります。そこで、テキストマイニングにおいてもtidyな処理を行えるtidytextパッケージの出番です。テキストのデータを元にその基本的な動きを確認しましょう。
sms_raw <- "./sample/mlwr/sms_spam_rev2.csv" %>%
  readr::read_csv() %>%
  dplyr::mutate(type = forcats::as_factor(type),
                text = stringr::str_to_lower(text) %>%
                  stringr::str_replace_all("[[:digit:]]", " ") %>%
                  tm::removeWords(tm::stopwords()) %>%
                  gsub("[[:punct:]]+", " ", .) %>%
                  tm::stemDocument() %>%
                  stringr::str_squish())

sms_raw
tidytextパッケージの基本
DTMはマトリクス型の変数ですが表示させると要約表示されてしまうために実際にどのようなデータになっているか把握することが難しいです。tidytext::tidy関数を用いるとDTMをtidy形式に変換することができます。
tidy形式になると処理も見えやすく扱いやすくなります。例えば、出現頻度の高いトークンを抽出するには以下のようなtidyな処理で記述することができるようになります。
sms_dtm %>%
tidytext::tidy() %>%
dplyr::group_by(term) %>%
dplyr::summarise(n = sum(count)) %>%
dplyr::filter(n >= 5)出力結果がデータフレームですので可視化するのは簡単で、ヒストグラムを描くとその分布は大きく右に歪んでいることが分かります。ここでは省略しますが頭文字でグルーピングして色分けするようなことも可能です。
sms_dtm %>%
  tidytext::tidy() %>%
  dplyr::group_by(term) %>%
  dplyr::summarise(n = sum(count)) %>%
dplyr::filter(n >= 5) %>%
ggplot2::ggplot(ggplot2::aes(x = n)) +
ggplot2::geom_histogram()
出現頻度の低いトークンはフィルターの条件を逆にすることで求められます。
sms_freq_anti <- sms_dtm %>%
  tidytext::tidy() %>%
  dplyr::group_by(term) %>%
  dplyr::summarise(n = sum(count)) %>%
  dplyr::filter(n < 5)

sms_freq_anti
クレンジング処理後のデータフレームをDTMに変換するには、まず、頻度表を作成し、その後DTMに変換します。手間がかかっているようですが、以下の処理で環境にもよりますが約170msec程で処理できます。
sms_dtm_tidy <- sms_raw %>%
  tibble::rownames_to_column("document") %>%
  tidytext::unnest_tokens(output = "term", input = "text") %>%
  dplyr::group_by(document, term) %>%
  dplyr::summarise(count = n()) %>%
  tidytext::cast_dtm(document = document, term = term, value = count)

tm::inspect(sms_dtm_tidy)
## <<DocumentTermMatrix (documents: 5552, terms: 6289)>>
## Non-/sparse entries: 48769/34867759
## Sparsity : 100%
## Maximal term length: 34
## Weighting : term frequency (tf)
## Sample :
## Terms
## Docs call can come get go just now u ur will
## 1707 0 1 0 1 0 0 0 4 0 0
## 2046 0 0 0 0 2 0 0 0 0 0
## 295 0 0 0 0 0 0 0 1 0 0
## 313 0 0 1 1 0 0 0 0 0 12
## 3201 0 0 0 0 0 0 0 1 0 0
## 3522 0 0 0 0 1 0 0 1 0 0
## 399 0 0 0 0 1 0 0 1 0 0
## 482 0 0 0 1 1 0 0 9 1 0
## 5068 0 0 0 0 0 0 0 3 0 0
## 5279 0 3 0 1 0 0 0 0 0 0一方、tmパッケージの場合は以下の処理で環境にもよりますが約1440msec程要しています。ただ、コーパス処理が若干異なっているようで、タームとしてはこちらの方がきれいに処理されているように見えます(uとかurとか省略形が処理されていてターム数としては300弱少ないことが読み取れます)。
sms_dtm_tm <- sms_raw %>%
  with(tm::VectorSource(text) %>% tm::VCorpus()) %>%
  tm::DocumentTermMatrix()

tm::inspect(sms_dtm_tm)
## <<DocumentTermMatrix (documents: 5559, terms: 5995)>>
## Non-/sparse entries: 42686/33283519
## Sparsity : 100%
## Maximal term length: 34
## Weighting : term frequency (tf)
## Sample :
## Terms
## Docs call can come day free get just know now will
## 1814 1 0 0 0 0 0 0 0 0 0
## 2046 0 0 0 0 0 0 0 1 0 0
## 295 0 0 0 0 1 0 0 0 0 0
## 2993 0 1 0 1 0 0 0 0 0 0
## 313 0 0 1 2 0 1 0 0 0 12
## 3201 0 0 0 0 1 0 0 0 0 0
## 3522 0 0 0 2 0 0 0 0 0 0
## 399 0 0 0 2 0 0 0 0 0 0
## 5068 0 0 0 6 0 0 0 0 0 0
## 5279 0 3 0 0 1 1 0 0 0 0
実際に処理してみる
では、テキストのサンプルコードをtmパッケージを用いずに処理してみましょう。
# データの読み込みとクレンジング
sms_raw <- "./sample/Machine Learning with R (2nd Ed.)/Chapter 04/sms_spam.csv" %>%
  readr::read_csv() %>%
  dplyr::mutate(type = forcats::as_factor(type),
                text = stringr::str_to_lower(text) %>%
                  stringr::str_replace_all("[[:digit:]]", " ") %>%
                  tm::removeWords(tm::stopwords()) %>%
                  gsub("[[:punct:]]+", " ", .) %>%
                  tm::stemDocument() %>%
                  stringr::str_squish()) %>%
  tibble::rownames_to_column("document")

# sms_raw

# ラベル用データフレームの作成
sms_label <- sms_raw %>%
  dplyr::select(.doc = document, .type = type)

# sms_label

# 頻度表の作成
sms_df <- sms_raw %>%
  tidytext::unnest_tokens(output = "term", input = "text") %>%
  dplyr::anti_join(tidytext::stop_words, by = c("term" = "word")) %>%
  dplyr::group_by(document, term) %>%
  dplyr::summarise(count = n())

# sms_df

# 出現頻度の低いトークンリストの作成
sms_freq_anti <- sms_df %>%
  dplyr::group_by(term) %>%
  dplyr::summarise(count = sum(count)) %>%
  dplyr::filter(count < 5) %>%
  dplyr::select(term)

# sms_freq_anti

# 出現頻度の高いトークンのみを抽出しトレーニング、テストに使えるデータに変換
sms_data <- sms_df %>%
  dplyr::anti_join(sms_freq_anti) %>%
  tidytext::cast_dtm(document = document, term = term, value = count) %>%
  as.matrix() %>% as.data.frame() %>%
  tibble::rownames_to_column(".doc") %>%
  dplyr::left_join(sms_label, ., by = c(".doc")) %>%
  tibble::column_to_rownames(".doc") %>%
  dplyr::mutate_if(is.numeric,
                   function(.){ifelse(. > 0, "Yes", "No")})

# sms_data

# トレーニングデータ、テストデータの作成
set.seed(seed)
split <- sms_data %>%
  rsample::initial_split(prop = 1 - 1390/5559)

sms_train <- split %>%
  rsample::training()   # .$in_idに該当するデータを取り出す

sms_test <- split %>%
  rsample::testing()    # .$in_idに該当しないデータを取り出す

e1071::naiveBayes(sms_train[, -1], sms_train$.type) %>%
  predict(sms_test[, -1]) %>%
  gmodels::CrossTable(sms_test$.type, dnn = c('predicted', 'actual'),
                      prop.chisq = FALSE, prop.t = FALSE, prop.r = FALSE)
##
##
## Cell Contents
## |-------------------------|
## | N |
## | N / Col Total |
## |-------------------------|
##
##
## Total Observations in Table: 1390
##
##
## | actual
## predicted | ham | spam | Row Total |
## -------------|-----------|-----------|-----------|
## ham | 1186 | 18 | 1204 |
## | 0.998 | 0.089 | |
## -------------|-----------|-----------|-----------|
## spam | 2 | 184 | 186 |
## | 0.002 | 0.911 | |
## -------------|-----------|-----------|-----------|
## Column Total | 1188 | 202 | 1390 |
## | 0.855 | 0.145 | |
## -------------|-----------|-----------|-----------|
##
##
クレンジング処理を変えてみる
tidytextパッケージでトークン化した後でクレンジング処理を試みてみます。あまり処理時間は短縮できないようです。
sms_raw <- "./sample/Machine Learning with R (2nd Ed.)/Chapter 04/sms_spam.csv" %>%
  readr::read_csv() %>%
  dplyr::mutate(type = forcats::as_factor(type)) %>%
  tibble::rownames_to_column("document")

# ラベル用データフレームの作成
sms_label <- sms_raw %>%
  dplyr::select(.doc = document, .type = type)

# 頻度表の作成(含むクレンジング処理)
sms_df <- sms_raw %>%
  tidytext::unnest_tokens(output = "term", input = "text") %>%
  dplyr::mutate(term = stringr::str_remove_all(term, "[[:digit:]]"))%>%
  dplyr::anti_join(tidytext::stop_words, by = c("term" = "word"))%>%
  dplyr::mutate(term = stringr::str_remove_all(term, "[[:punct:]]") %>%
                  tm::stemDocument() %>%
                  # stringr::str_squish() %>%
                  dplyr::if_else(. == "", NA_character_, .)) %>%
  tidyr::drop_na(term) %>%
  dplyr::group_by(document, term) %>%
  dplyr::summarise(count = n())

# 出現頻度の低いトークンリストの作成
sms_freq_anti <- sms_df %>%
  dplyr::group_by(term) %>%
  dplyr::summarise(count = sum(count)) %>%
  dplyr::filter(count < 5) %>%
  dplyr::select(term)

# 出現頻度の高いトークンのみを抽出しトレーニング、テストに使えるデータに変換
sms_data <- sms_df %>%
  dplyr::anti_join(sms_freq_anti) %>%
  tidytext::cast_dtm(document = document, term = term, value = count) %>%
  as.matrix() %>% as.data.frame() %>%
  tibble::rownames_to_column(".doc") %>%
  dplyr::left_join(sms_label, ., by = c(".doc")) %>%
  tibble::column_to_rownames(".doc") %>%
  dplyr::mutate_if(is.numeric, tidyr::replace_na, replace = 0) %>%
  dplyr::mutate_if(is.numeric,
                   function(.){ifelse(. > 0, "Yes", "No")})

# トレーニングデータ、テストデータの作成
set.seed(seed)
split <- sms_data %>%
  rsample::initial_split(prop = 1 - 1390/5559)

sms_train <- split %>%
  rsample::training()   # .$in_idに該当するデータを取り出す

sms_test <- split %>%
  rsample::testing()    # .$in_idに該当しないデータを取り出す

e1071::naiveBayes(sms_train[, -1], sms_train$.type) %>%
  predict(sms_test[, -1]) %>%
  gmodels::CrossTable(sms_test$.type, dnn = c('predicted', 'actual'),
                      prop.chisq = FALSE, prop.t = FALSE, prop.r = FALSE)
##
##
## Cell Contents
## |-------------------------|
## | N |
## | N / Col Total |
## |-------------------------|
##
##
## Total Observations in Table: 1390
##
##
## | actual
## predicted | ham | spam | Row Total |
## -------------|-----------|-----------|-----------|
## ham | 1185 | 24 | 1209 |
## | 0.997 | 0.119 | |
## -------------|-----------|-----------|-----------|
## spam | 3 | 178 | 181 |
## | 0.003 | 0.881 | |
## -------------|-----------|-----------|-----------|
## Column Total | 1188 | 202 | 1390 |
## | 0.855 | 0.145 | |
## -------------|-----------|-----------|-----------|
##
## トレーニングデータを二値化しない
テキストではDTM(頻度表)を“YES/NO”で二値化したものでトレーニング、テストを行っていますが、DTM(頻度表)のままトレーニング、テストを行ったらどうなるのでしょうか?結論からいえばテストデータは\(100\%\)スパムと判定されてしまいます。では、なぜ、このようなことが起こるのでしょうか?
ナイーブベイズの実装
Rのナイーブベイズ関数に数値(連続値)を渡した場合、テキストで説明のあった尤度(確率)でなくデータの分布(密度分布)を利用してモデルを作成します。ベーシックな手法としては正規分布にしたがうことを前提とするガウシアン・ナイーブベイズがあります。つまり、トレーニングデータの分布(事前分布)からモデルの分布(尤度)を計算する点が大きな違いです。
ガウシアン・ナイーブベイズは \[P(C_L \mid F_1, ..., F_n) = \frac{1}{Z}P(C_L)\prod_{i = 1}^{n}{P(F_i \mid C_L)}\]
の右辺の事前確率をガウス分布に置き換えるイメージです。 \[P(F_i \mid C_L) = \frac{1}{\sqrt{2 \pi \sigma ^2_i}}exp^{- \frac{(F - \mu_i)^2}{2 \sigma ^2_i}}\]
事前分布の確認
そこで、トレーニングデータの中からワードクラウドで大きなサイズで表示された単語を抜き出して、そのヒストグラムの密度曲線(分布)を描いてみます。
sms_dtm_freq_train %>%
  as.matrix() %>% as.data.frame() %>%
  dplyr::select(call, can, come, free, get, just, know, now, will) %>%
  dplyr::mutate(.label = sms_train_labels) %>%
  dplyr::select(.label, dplyr::everything()) %>%
  tidyr::gather(key = key, value = value, -.label) %>%
  ggplot2::ggplot(ggplot2::aes(x = value, fill = .label)) +
    ggplot2::geom_density(ggplot2::aes(colour = .label), alpha = 0.25) +
    ggplot2::facet_wrap(~ key, ncol = 2) + ggplot2::xlim(0, 3)
トレーニングデータであるDTMはテキストで説明されているように疎行列なのでスパムでもハムでも殆どのデータが\(0\)であるため、大きく右に歪んだ分布になっていることがわかります。しかも、スパムもハムも似たような分布です。頻度\(0\)の分布の違い程度を除いてほとんど差がありません。
では、このデータを用いてklaR::NaiveBayes関数で学習モデルを作成し、そのモデルを確認してみます。
sms_dtm_freq_train %>%
  as.matrix() %>% as.data.frame() %>%
  dplyr::select(call, can, come, free, get, just, know, now, will) %>%
  dplyr::mutate(.label = sms_train_labels) %>%
  dplyr::select(.label, dplyr::everything()) %>%
  klaR::NaiveBayes(.label ~ ., data = .) %>%
  plot(xlim = c(0, 3))


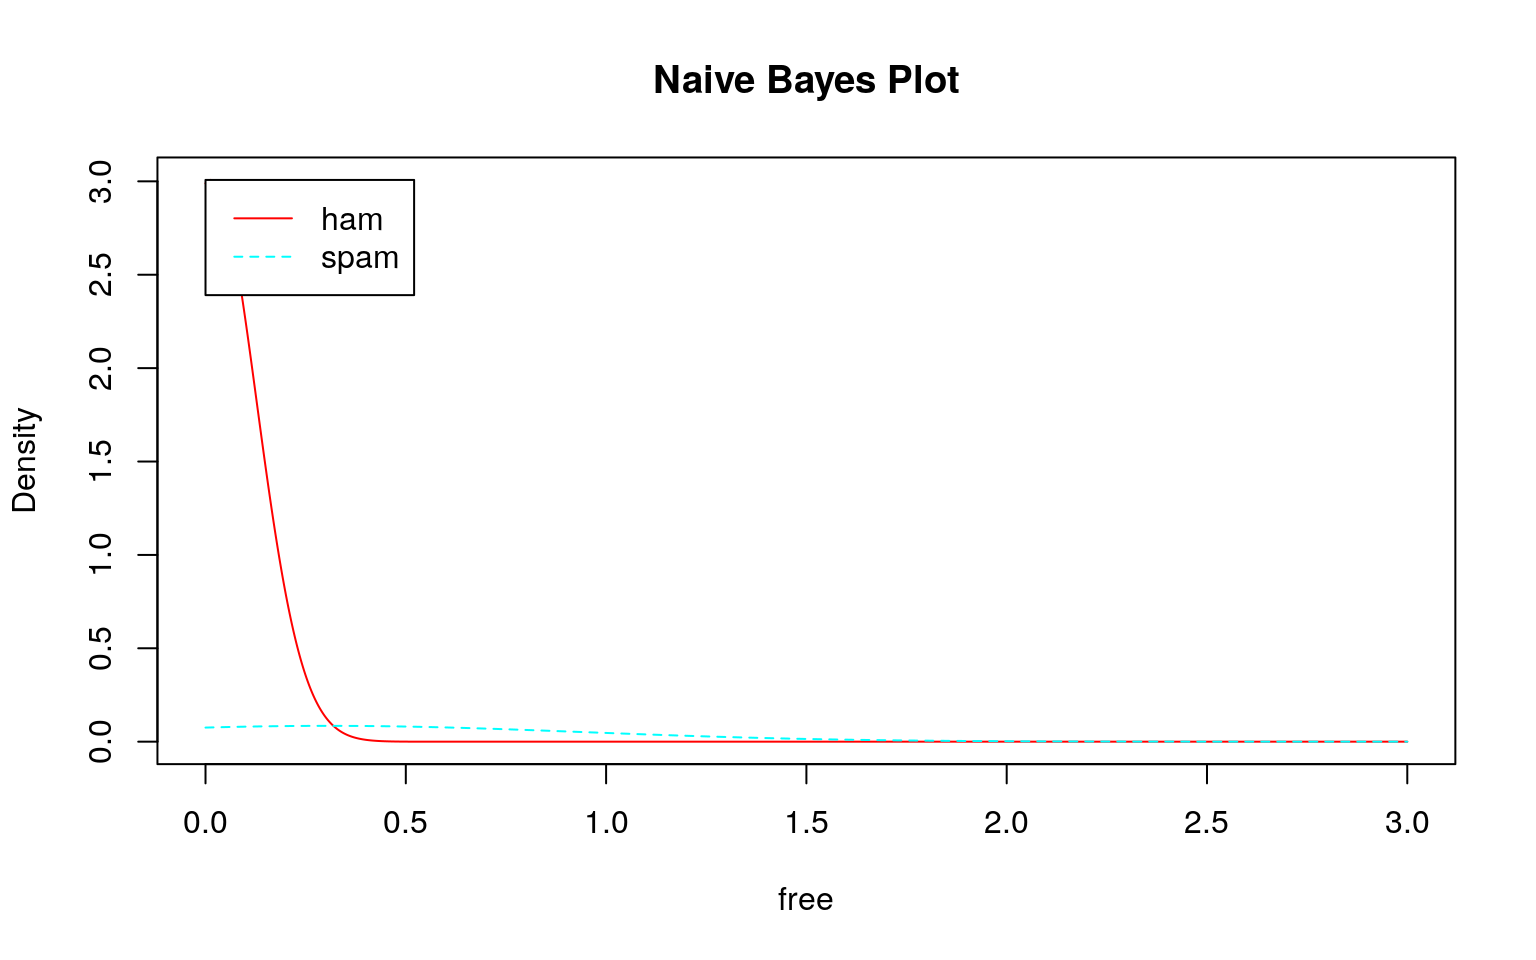
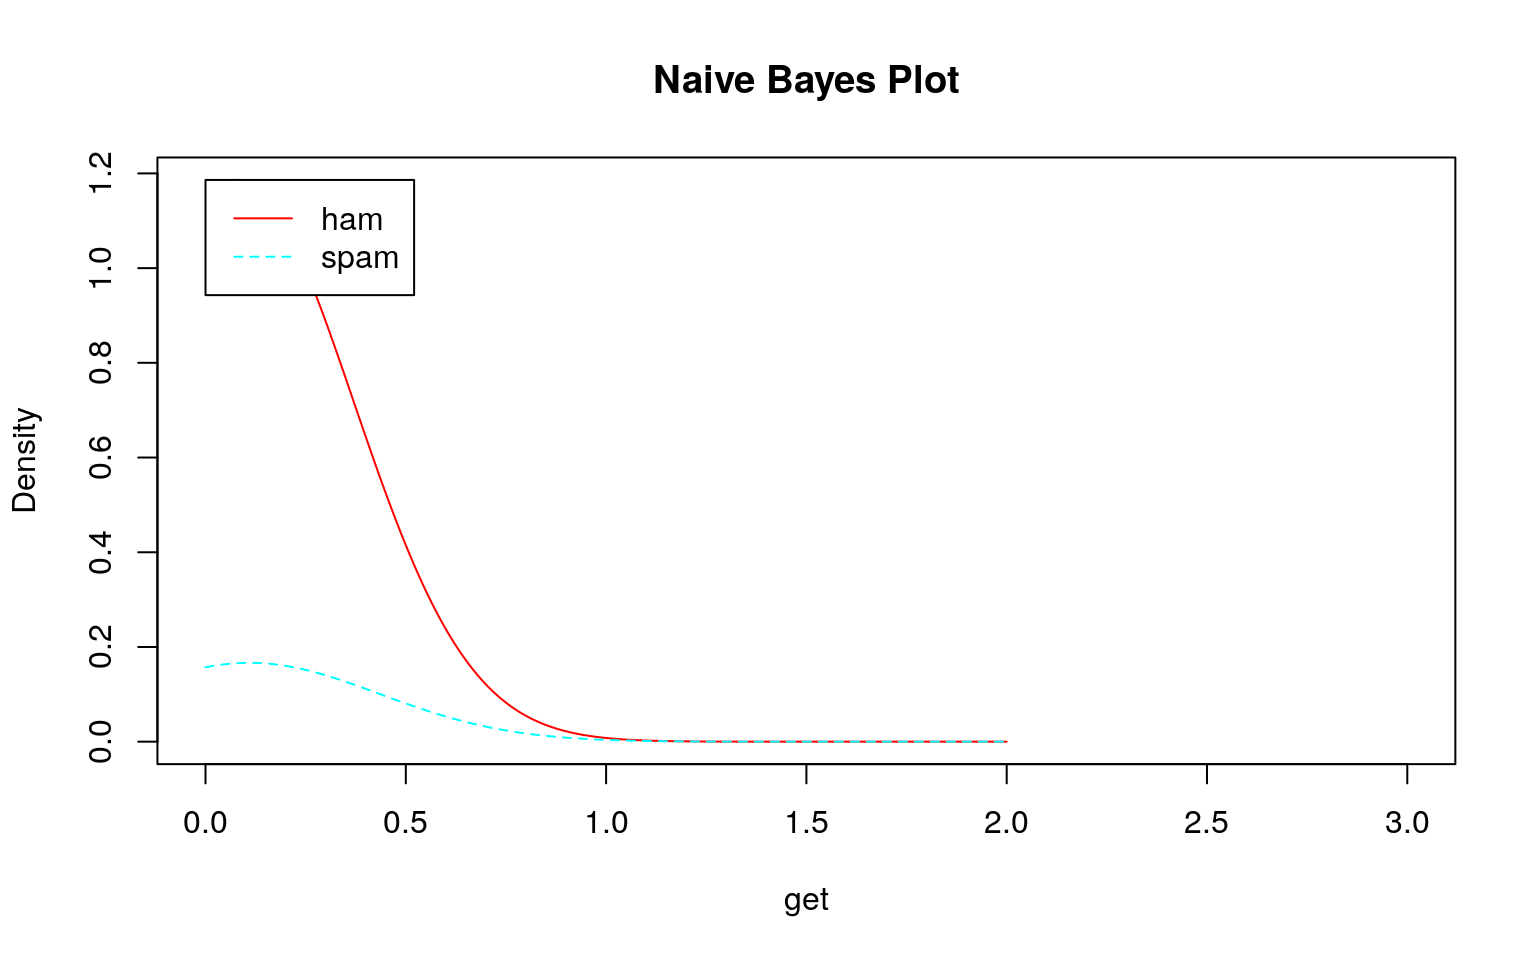
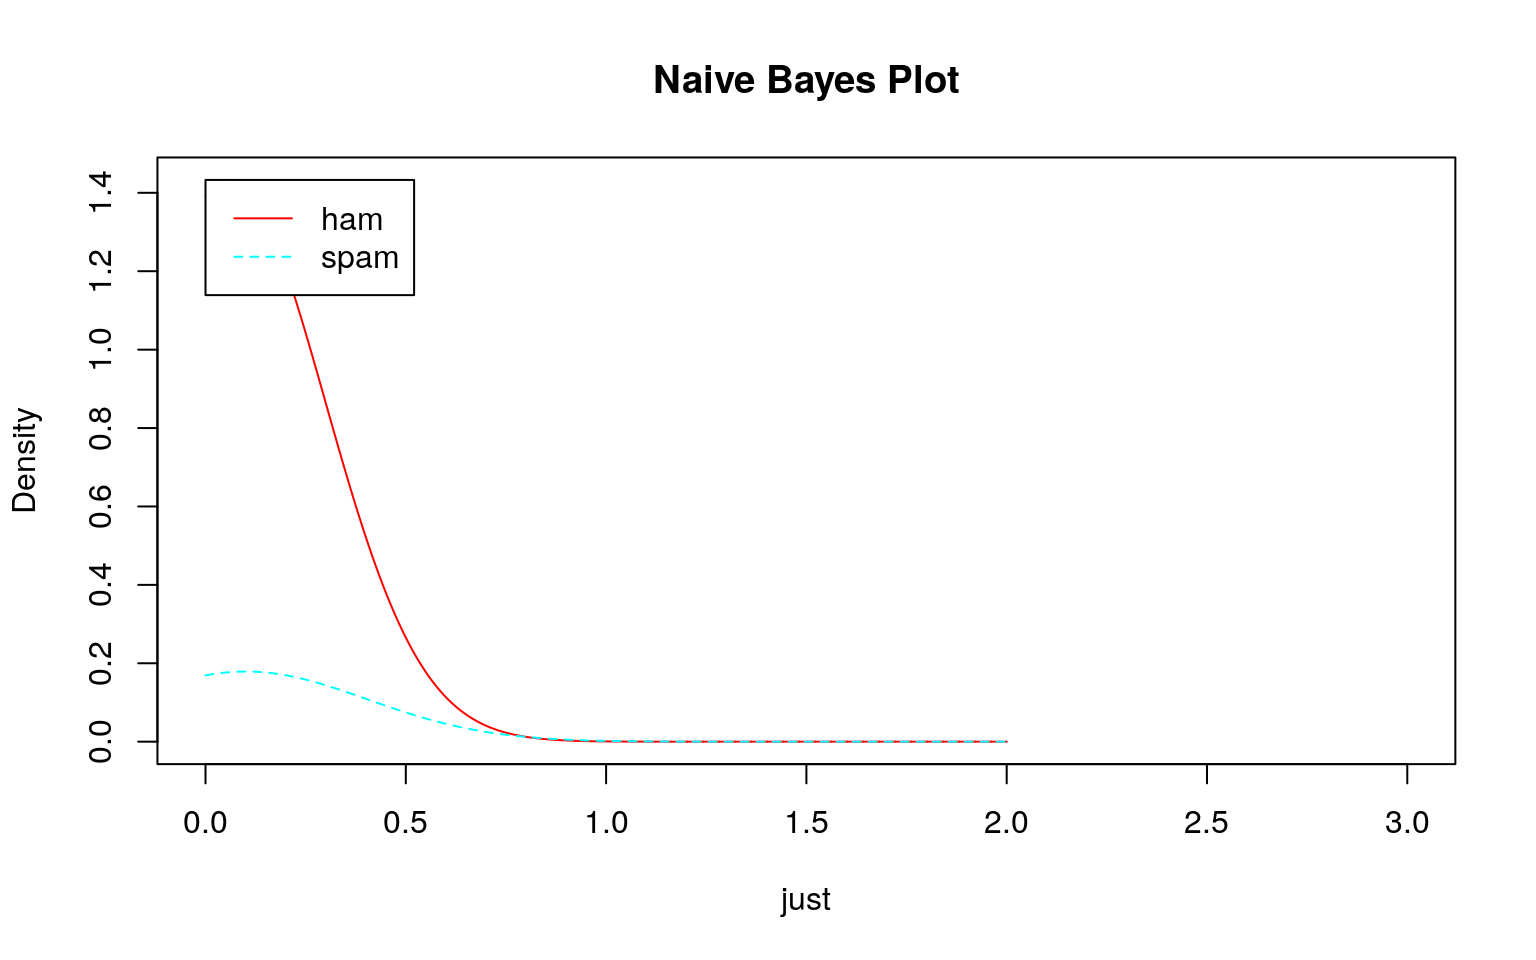
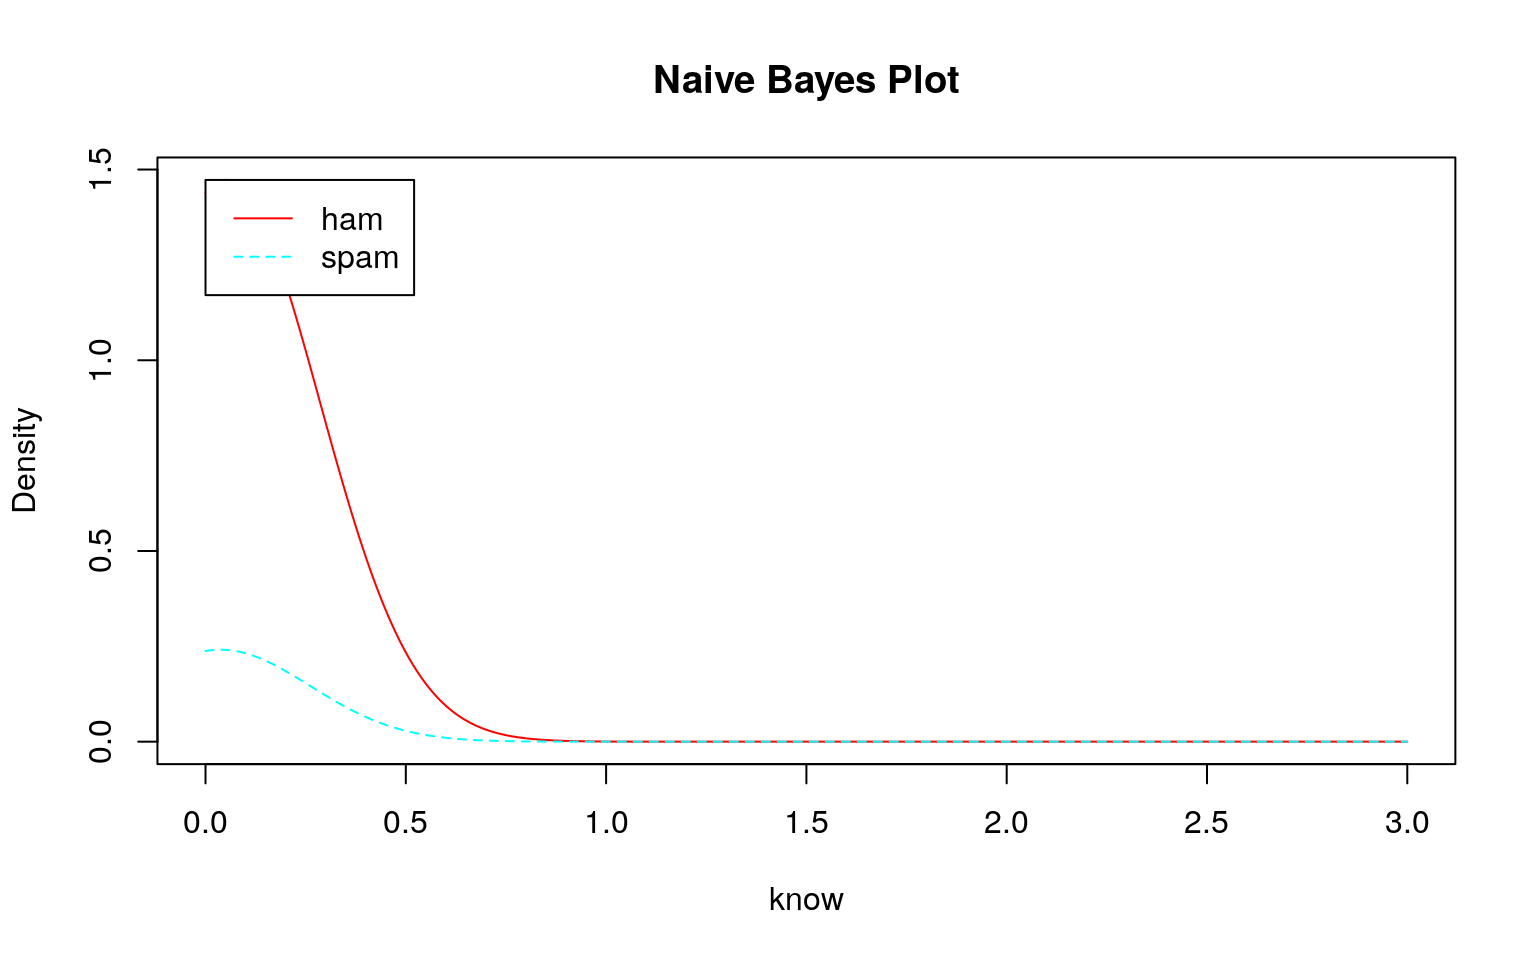
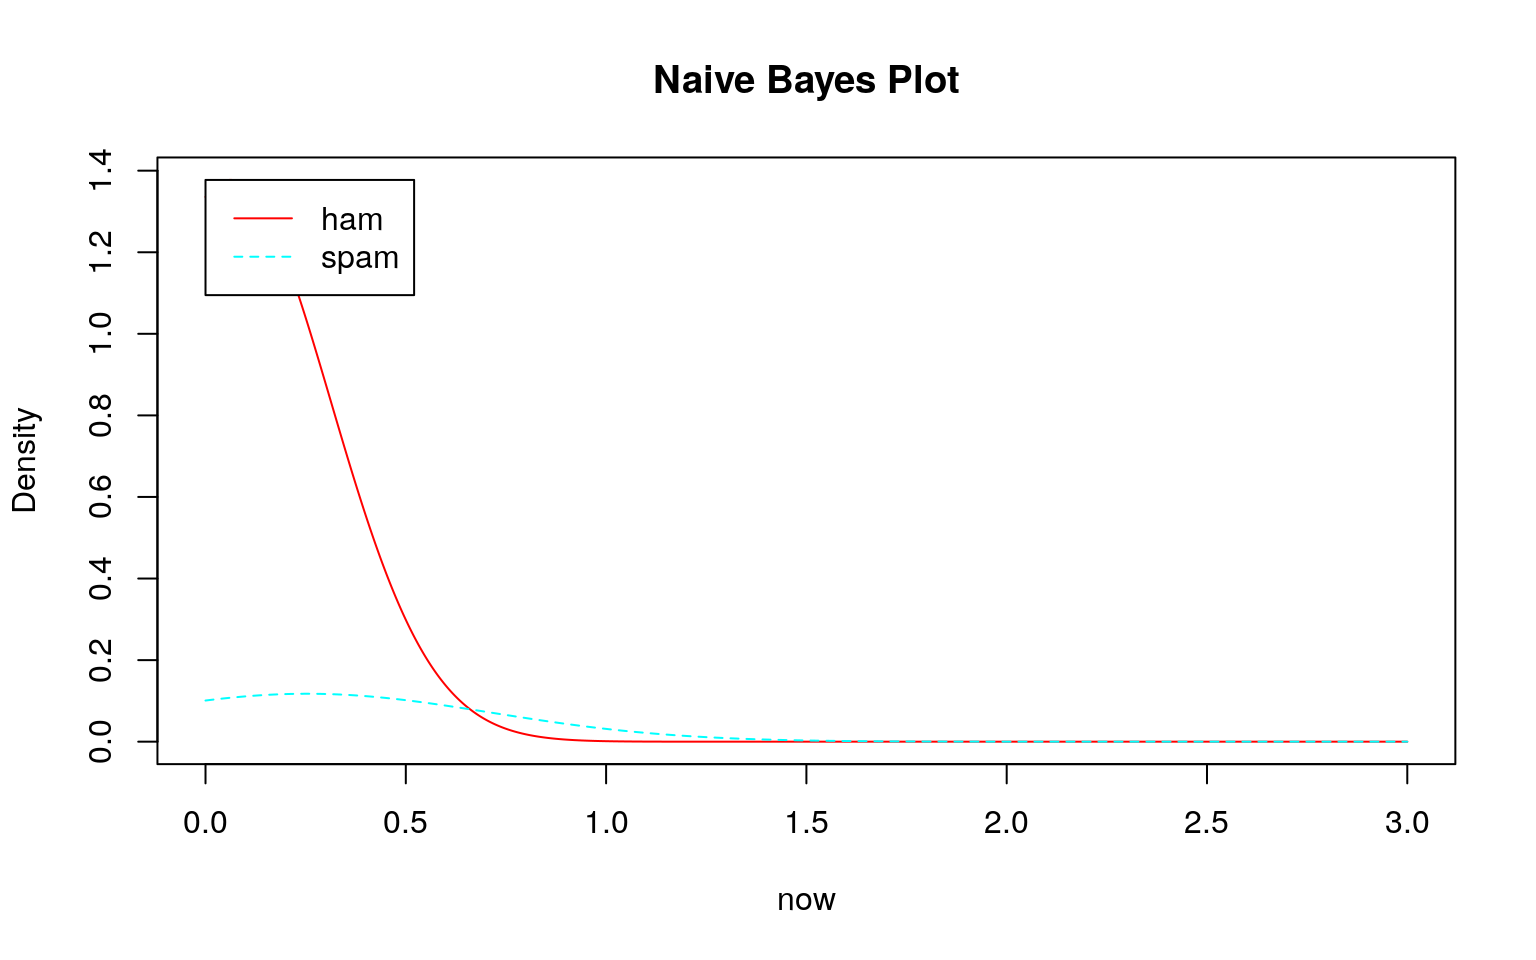
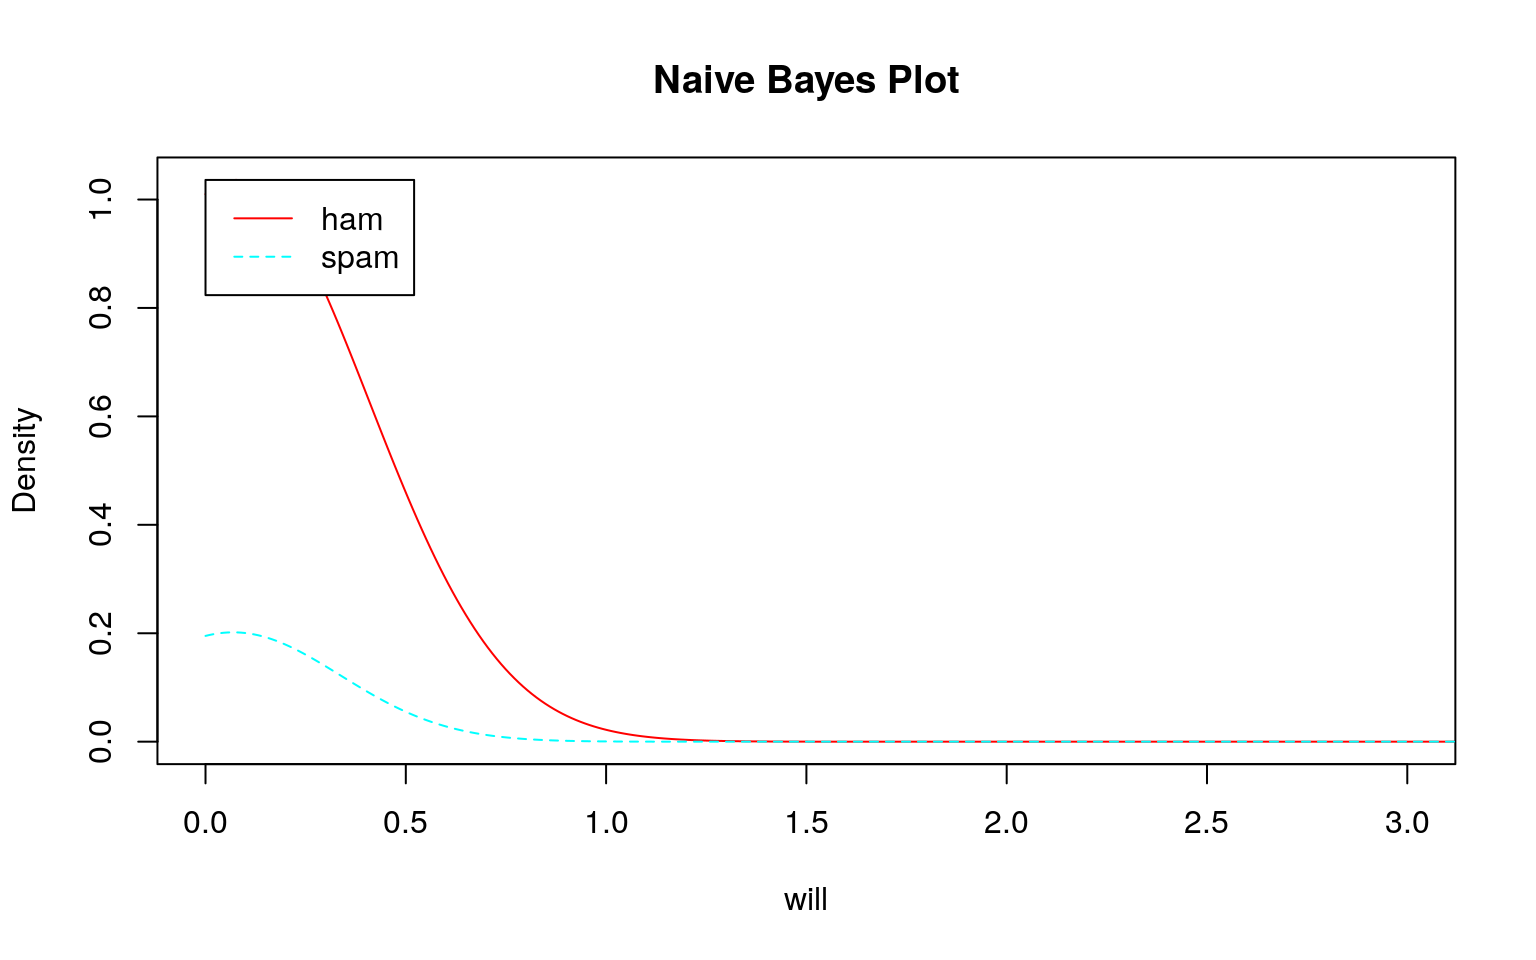
どのモデル(学習結果)をみてもスパムとハムの区別がつきにくい(つかない)ことが分かります。このような分布になるため、テストデータを投入してもスパムとハムの区別がつけられずに\(100\%\)スパムになると考えられます。
参考)irisデータセットの場合
irisデータセットで上手く分類できるのは、下図のようにデータの分布に違いがあるためです。
iris %>%
  tidyr::gather(key = "key", value = "value", -Species) %>%
  ggplot2::ggplot(ggplot2::aes(x = value, fill = Species)) +
    ggplot2::geom_density(ggplot2::aes(colour = Species), alpha = 0.25) +
    ggplot2::facet_wrap(~ key)
SMSと同様にklaR::NaiveBayes関数を用いて学習モデルを作成し、そのモデル(尤度)を確認してみます。


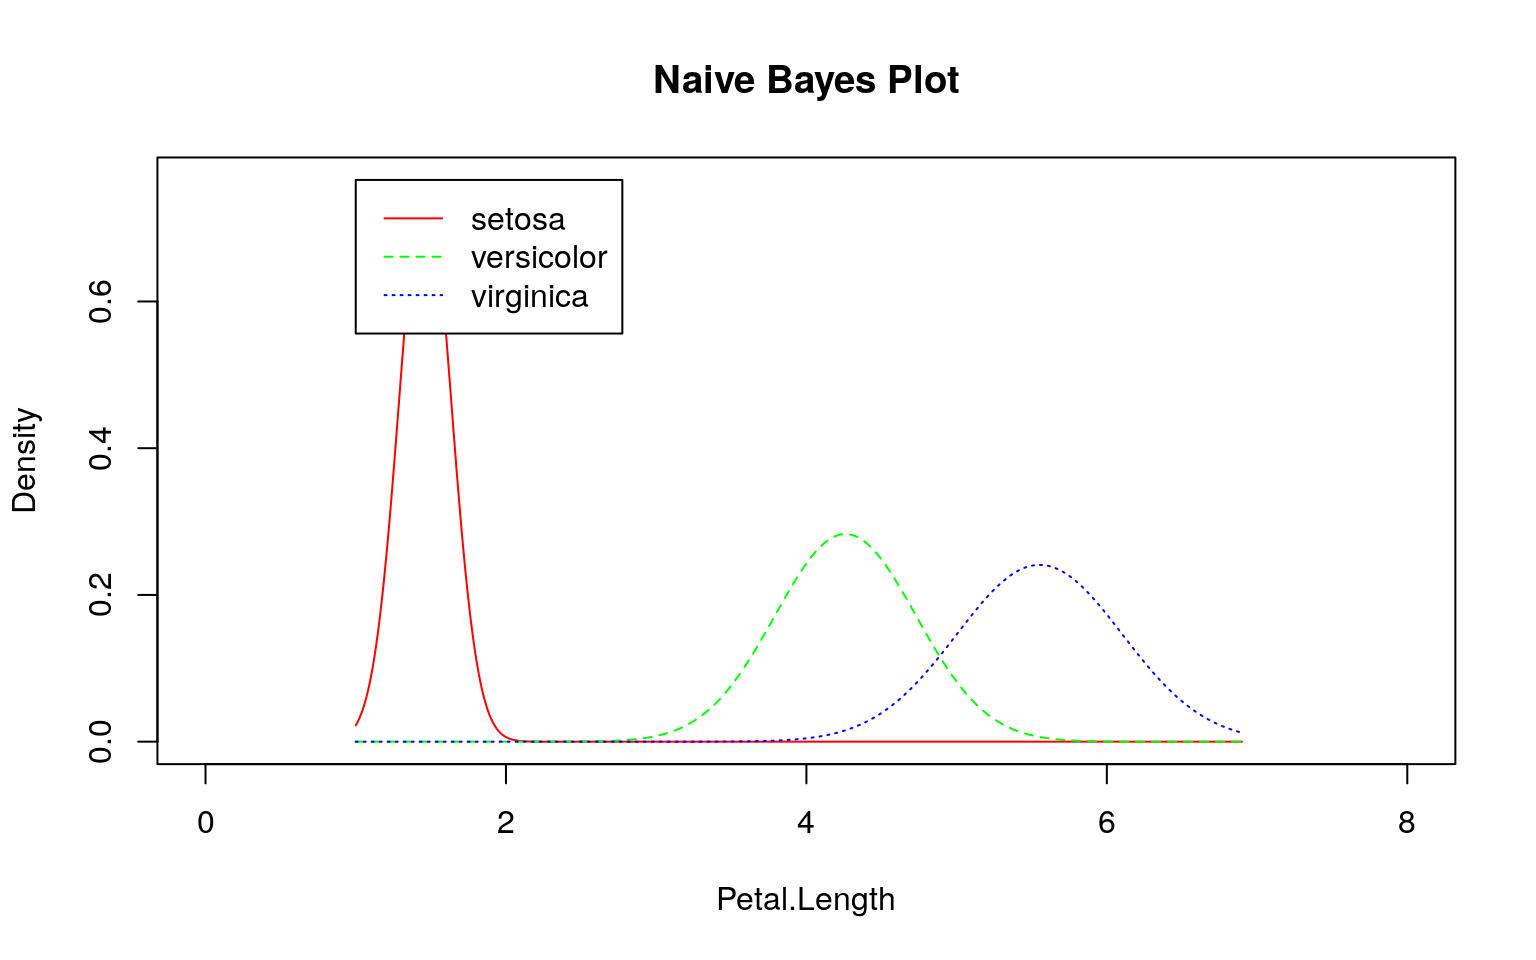
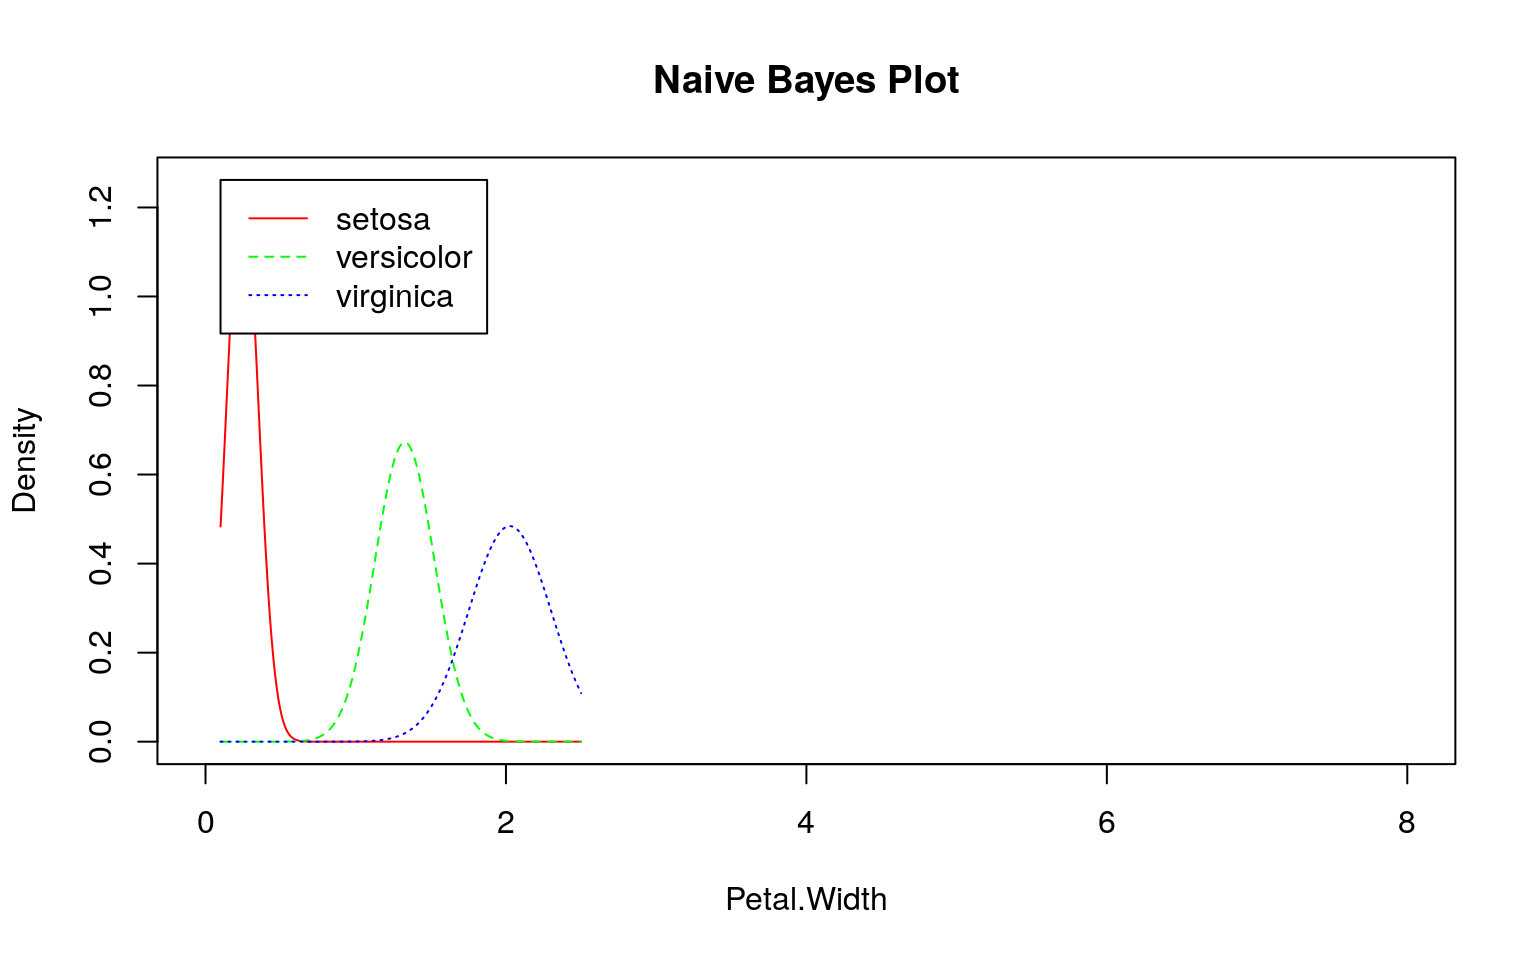
ここでも事前にデータを観察する必要があることが分かります。
ナイーブベイズが不得手?な場合
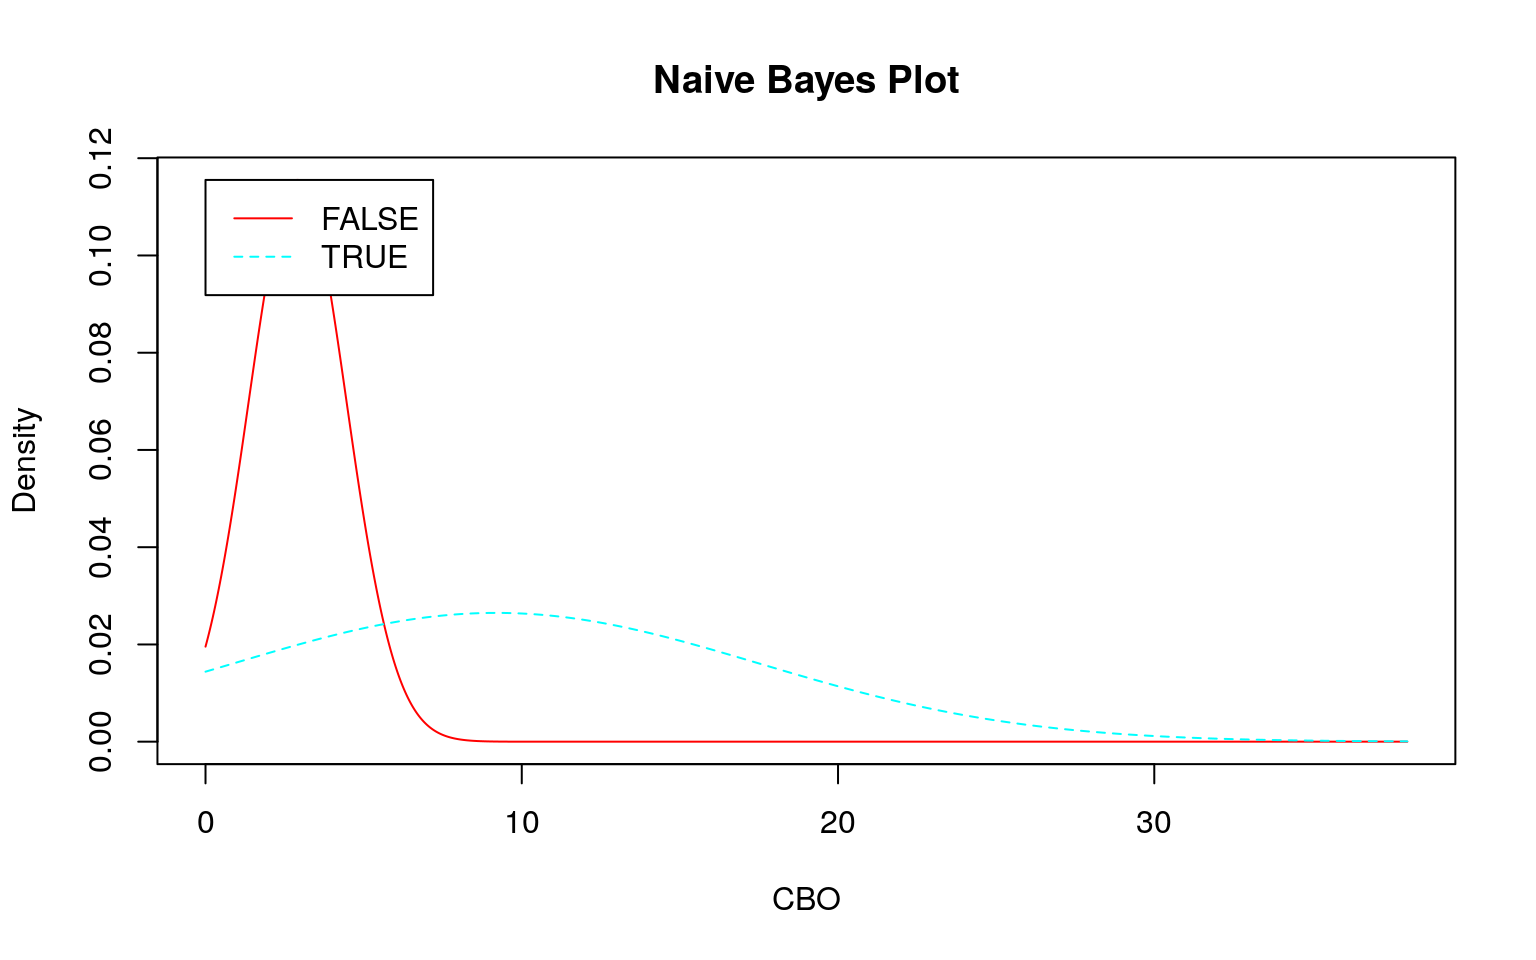
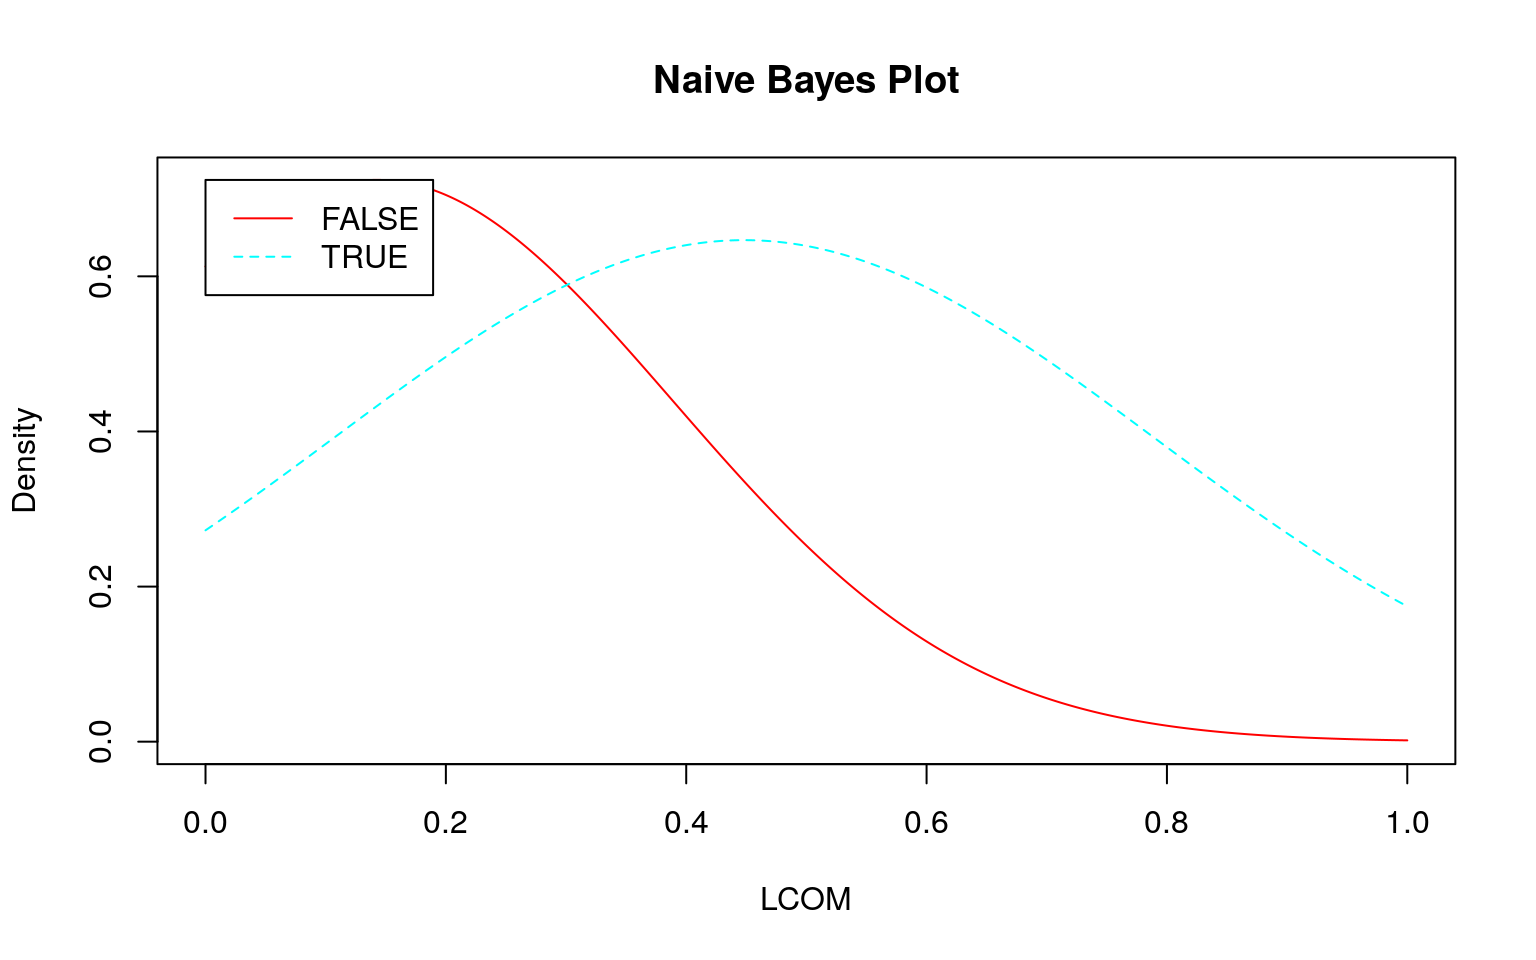
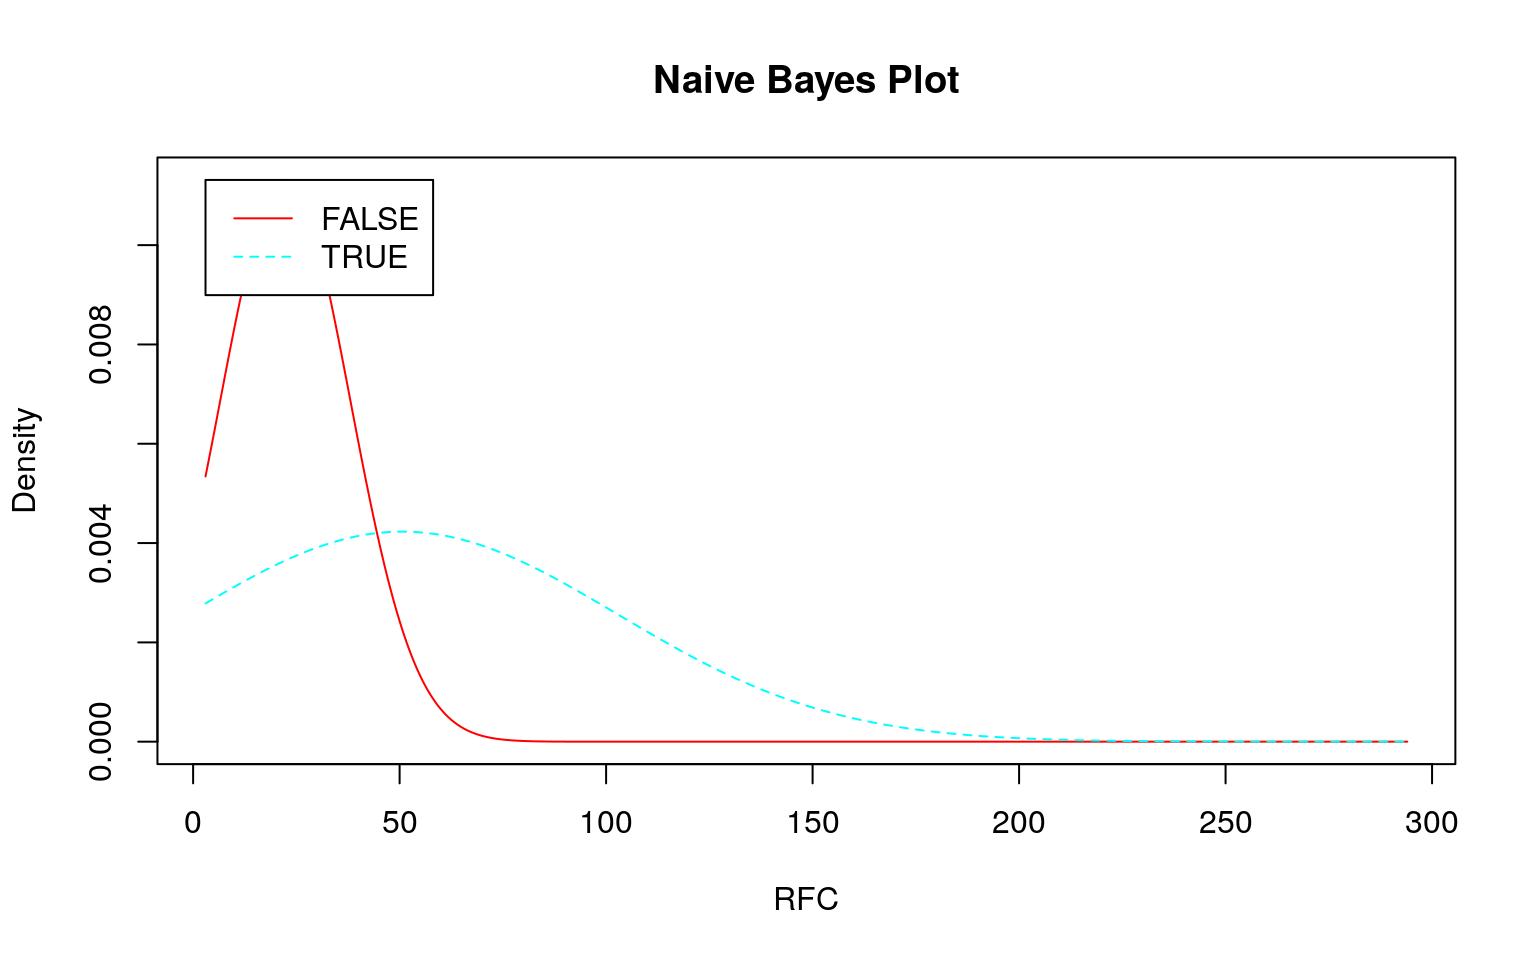
連続値の場合、前述のように事前分布から事後分布を計算しますが、その際に正規分布を仮定しています。そこで 『データ指向のソフトウェア品質マネジメント』 (通称デート本)の第4.3節にある「欠陥が生じやすいモジュールの予測」のデータのように大きく右に歪んだデータを使うとどのような予測になるか確認してみます。なお、利用するデータはデート本の案内を参考にダウンロードしてください。

set.seed(seed)
train <- x %>%
  dplyr::sample_frac(size = 0.75)

test <- train %>%
  dplyr::anti_join(x, .)

train %>%
  klaR::NaiveBayes(Modify ~ ., data = .) %>%
  plot()

set.seed(seed)
train %>%
  klaR::NaiveBayes(Modify ~ ., data = .) %>%
  predict(test[, -6]) %>%
  .$class %>%
  gmodels::CrossTable(test$Modify, dnn = c("Predict", "Actual"),
                      prop.chisq = FALSE, prop.t = FALSE, prop.r = FALSE)
##
##
## Cell Contents
## |-------------------------|
## | N |
## | N / Col Total |
## |-------------------------|
##
##
## Total Observations in Table: 24
##
##
## | Actual
## Predict | FALSE | TRUE | Row Total |
## -------------|-----------|-----------|-----------|
## FALSE | 5 | 8 | 13 |
## | 0.833 | 0.444 | |
## -------------|-----------|-----------|-----------|
## TRUE | 1 | 10 | 11 |
## | 0.167 | 0.556 | |
## -------------|-----------|-----------|-----------|
## Column Total | 6 | 18 | 24 |
## | 0.250 | 0.750 | |
## -------------|-----------|-----------|-----------|
##
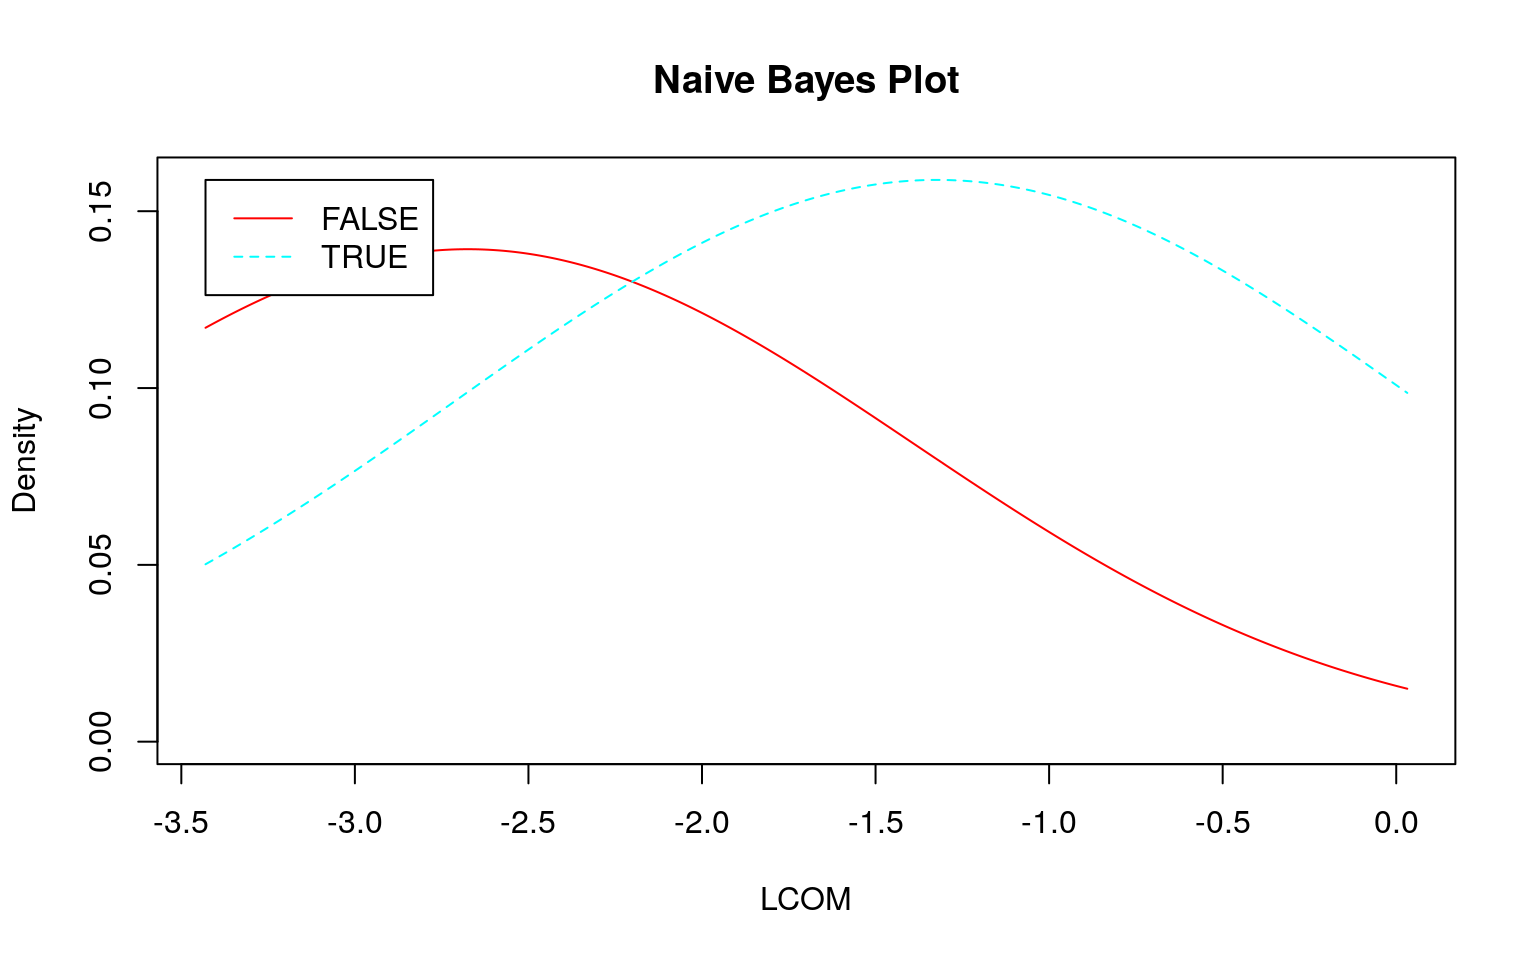
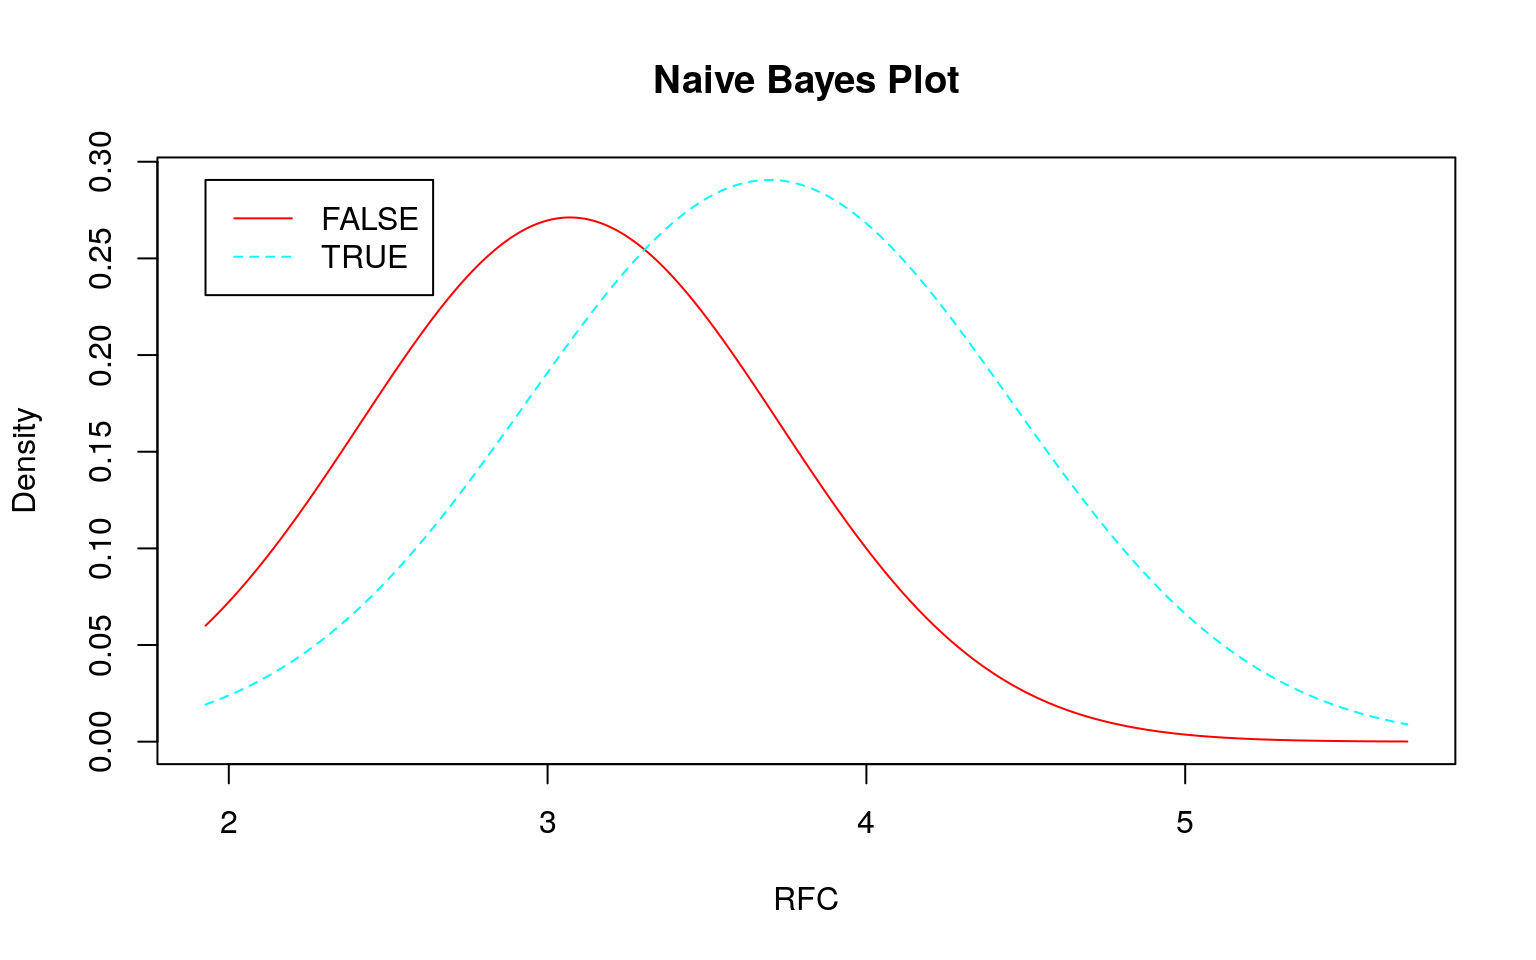
## 対数変換してみる
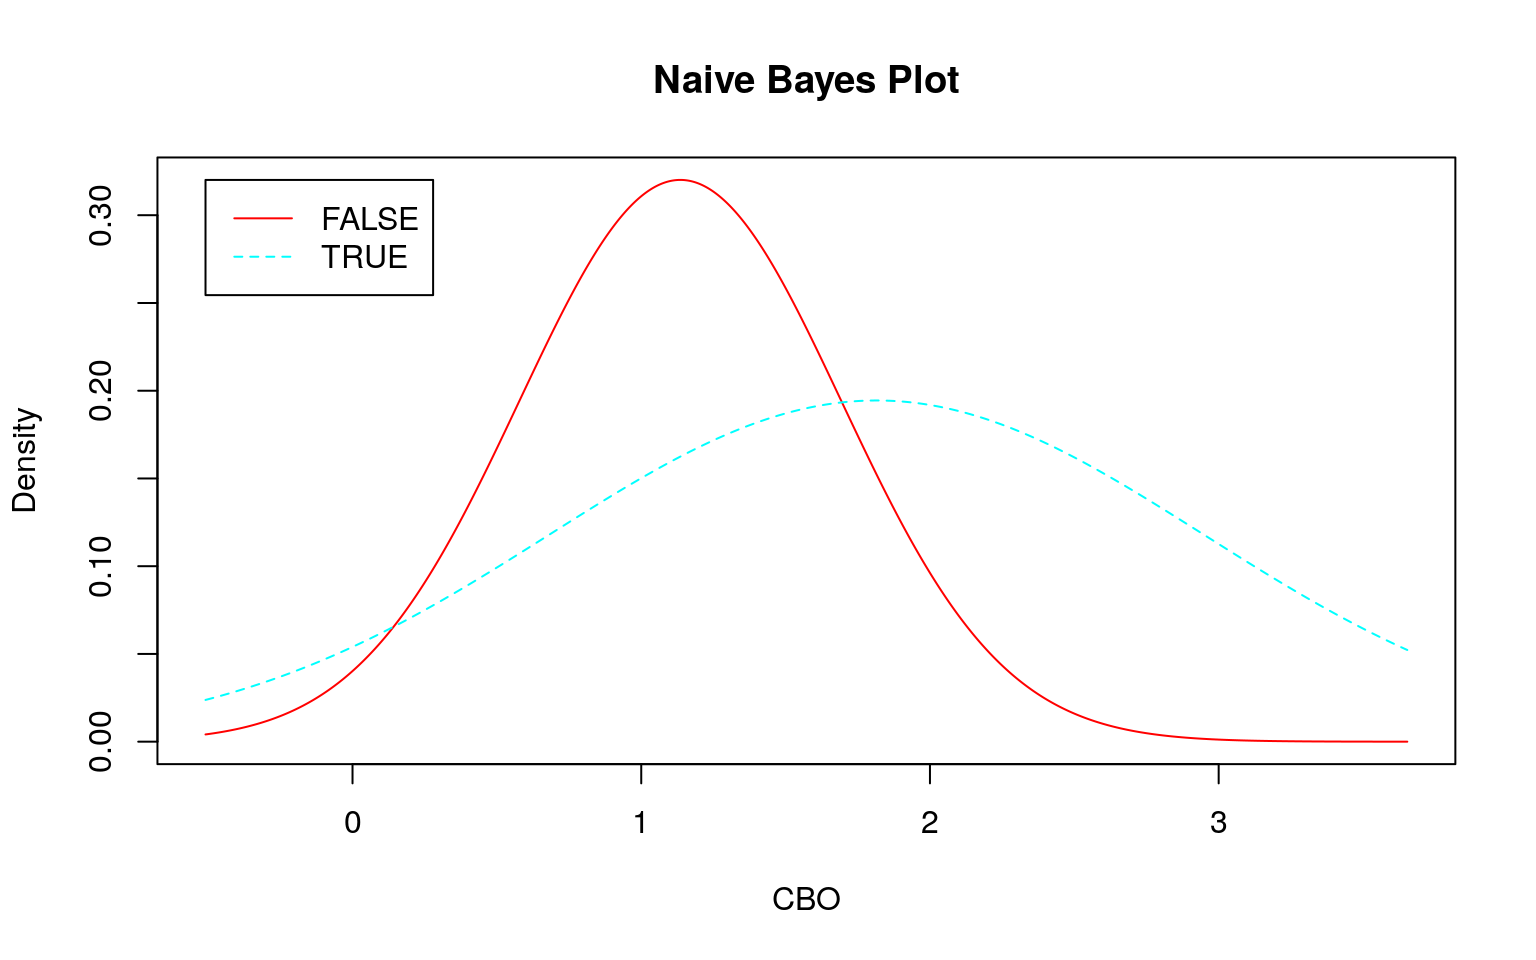
各データの分布を正規分布に近づけるために対数変換をします。\(0\)は対数変換できませんので、\(0\)には各データの平均値に\(\frac{1}{10}\)を乗じた値を加えてから対数変換します。
add_one <- function(x) {
  log(x + mean(x)/10)
}

xlog <- x %>%
  dplyr::mutate_if(is.numeric, add_one)

xlog %>%
  GGally::ggpairs(ggplot2::aes(colour = Modify, fill = Modify, alpha = 0.5),
                  progress = FALSE)
set.seed(seed)
train <- xlog %>%
  dplyr::sample_frac(size = 0.75)

test <- train %>%
  dplyr::anti_join(xlog, .)

xlog %>%
  skimr::skim_to_wide()

set.seed(seed)
train %>%
  klaR::NaiveBayes(Modify ~ ., data = .) %>%
  predict(test[, -6]) %>%
  .$class %>%
  gmodels::CrossTable(test$Modify, dnn = c("Predict", "Actual"),
                      prop.chisq = FALSE, prop.t = FALSE, prop.r = FALSE)
##
##
## Cell Contents
## |-------------------------|
## | N |
## | N / Col Total |
## |-------------------------|
##
##
## Total Observations in Table: 24
##
##
## | Actual
## Predict | FALSE | TRUE | Row Total |
## -------------|-----------|-----------|-----------|
## FALSE | 2 | 6 | 8 |
## | 0.333 | 0.333 | |
## -------------|-----------|-----------|-----------|
## TRUE | 4 | 12 | 16 |
## | 0.667 | 0.667 | |
## -------------|-----------|-----------|-----------|
## Column Total | 6 | 18 | 24 |
## | 0.250 | 0.750 | |
## -------------|-----------|-----------|-----------|
##
## 最近傍法の場合
set.seed(seed)
k <- e1071::tune.knn(x = train[, -6], y = train[, 6], k = c(1:30))

set.seed(seed)
knn_model <- class::knn(train = train[, -6], test = test[, -6],
                         cl = train$Modify, k = k$best.parameters$k) %>%
  gmodels::CrossTable(x = ., y = test$Modify, dnn = c("Predict", "Actual"),
                      prop.chisq = FALSE, prop.r = FALSE, prop.t = FALSE)
##
##
## Cell Contents
## |-------------------------|
## | N |
## | N / Col Total |
## |-------------------------|
##
##
## Total Observations in Table: 24
##
##
## | Actual
## Predict | FALSE | TRUE | Row Total |
## -------------|-----------|-----------|-----------|
## FALSE | 5 | 6 | 11 |
## | 0.833 | 0.333 | |
## -------------|-----------|-----------|-----------|
## TRUE | 1 | 12 | 13 |
## | 0.167 | 0.667 | |
## -------------|-----------|-----------|-----------|
## Column Total | 6 | 18 | 24 |
## | 0.250 | 0.750 | |
## -------------|-----------|-----------|-----------|
##
## こういう歪んだ分布や分布の差がないような場合はナイーブベイズはあまり良い結果が出せませんので、不得手といっていいかもしれません。このような場合には最近傍法の方が好ましそうです。